When I visited Japan, I would stumble across reviews like this on Tabelog:
This place was life changing! I mean literally, they saved my mom’s life, the employee performed CPR. They also gave me a free meal for my troubles. 4 stars.
Meanwhile back home on Google Maps, I see reviews like this:
This place sucks! I mean literally, the employee killed my mom with some peanuts. They didn’t even comp the meal. 4 stars.
Rating norms are a mess, which makes it hard to communicate about important things like which movies, books, and restaurants we should waste our time and money on.
We can’t unilaterally change the system everyone uses, but we can at least design a personal system that is more useful than the status quo. We’ll stick to the five-star scale, half stars included, since that’s what most platforms use.
Why and how to rate
Rating is fundamentally a compression problem. We’re taking the full richness of our experience and cramming it into a handful of discrete buckets. The question is where to draw the bucket boundaries – and like any compression problem, the answer depends on what information we care about preserving.
Specifically, ratings serve two purposes: personal tracking and communicating with others. The better our compression scheme captures our actual experience, the more useful our ratings become for both.
Let’s formalize this.
Think of rating as projecting our personal percentile rankings onto a 10-point scale. I’ll use movies as the running example, but the same logic applies to restaurants, books, or anything else you might rate. We’ll condition on selection bias – a “50th percentile movie” means median among films we’ve watched, not all films ever made.
To maximize the entropy that our ratings convey, we can simply use a uniform distribution:
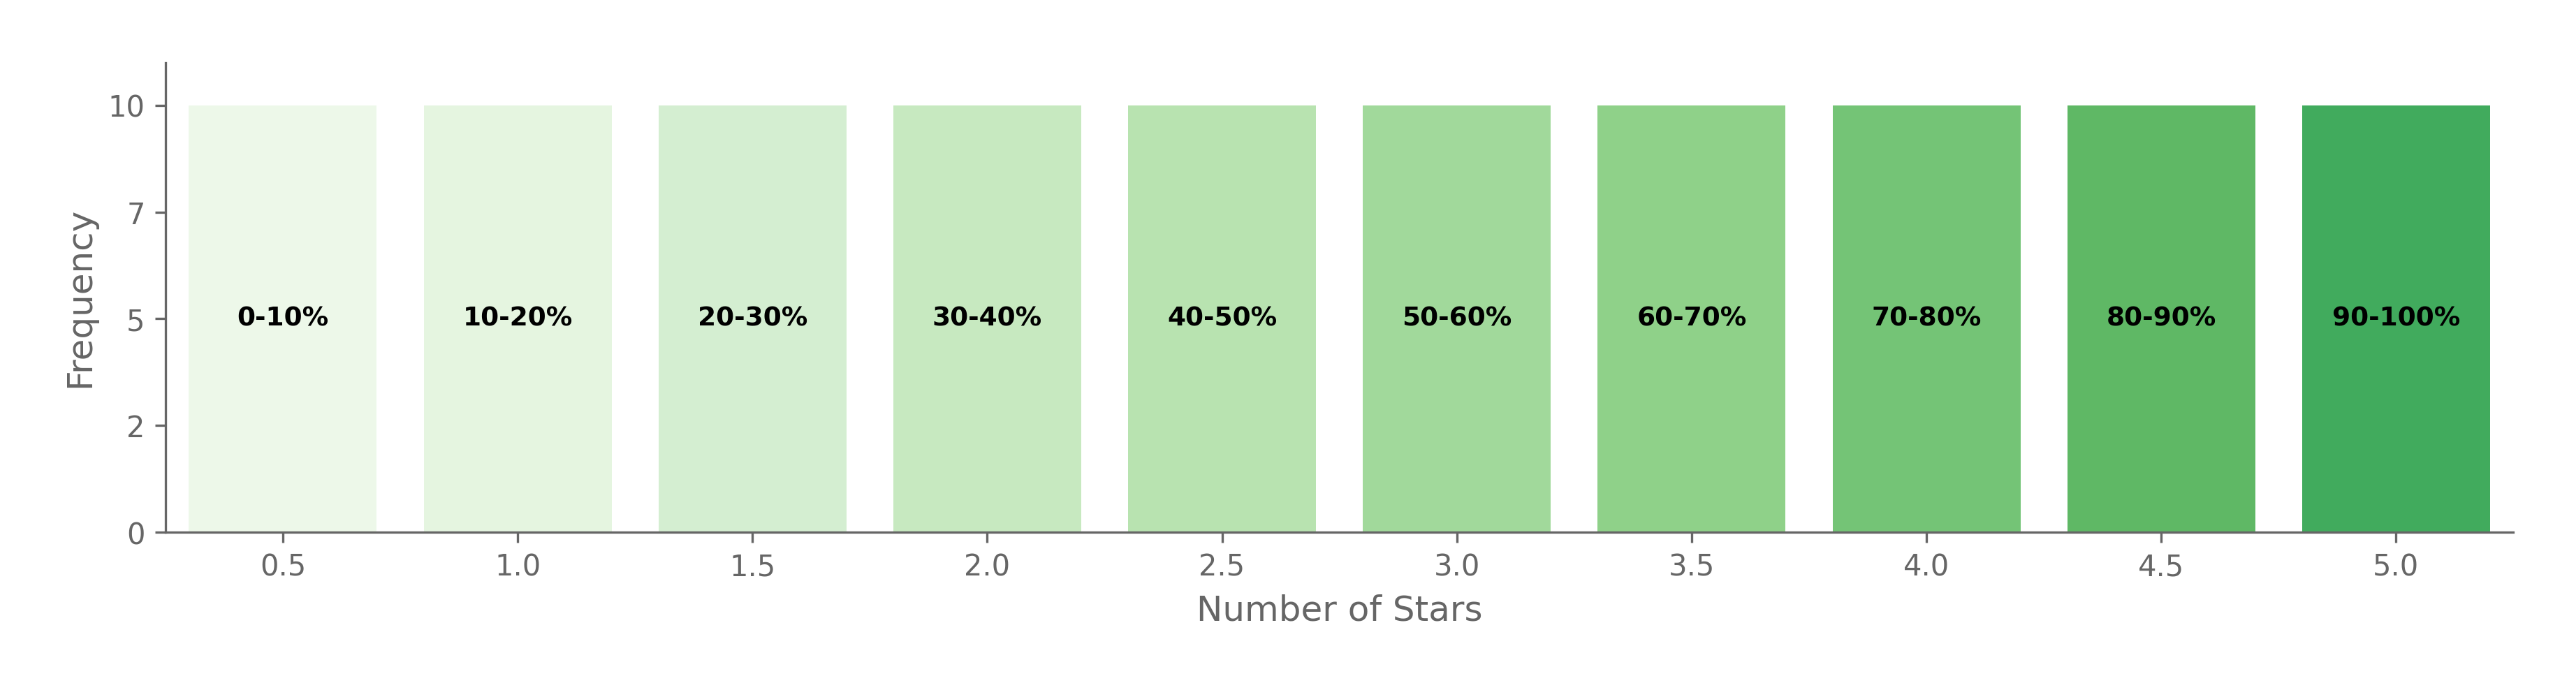
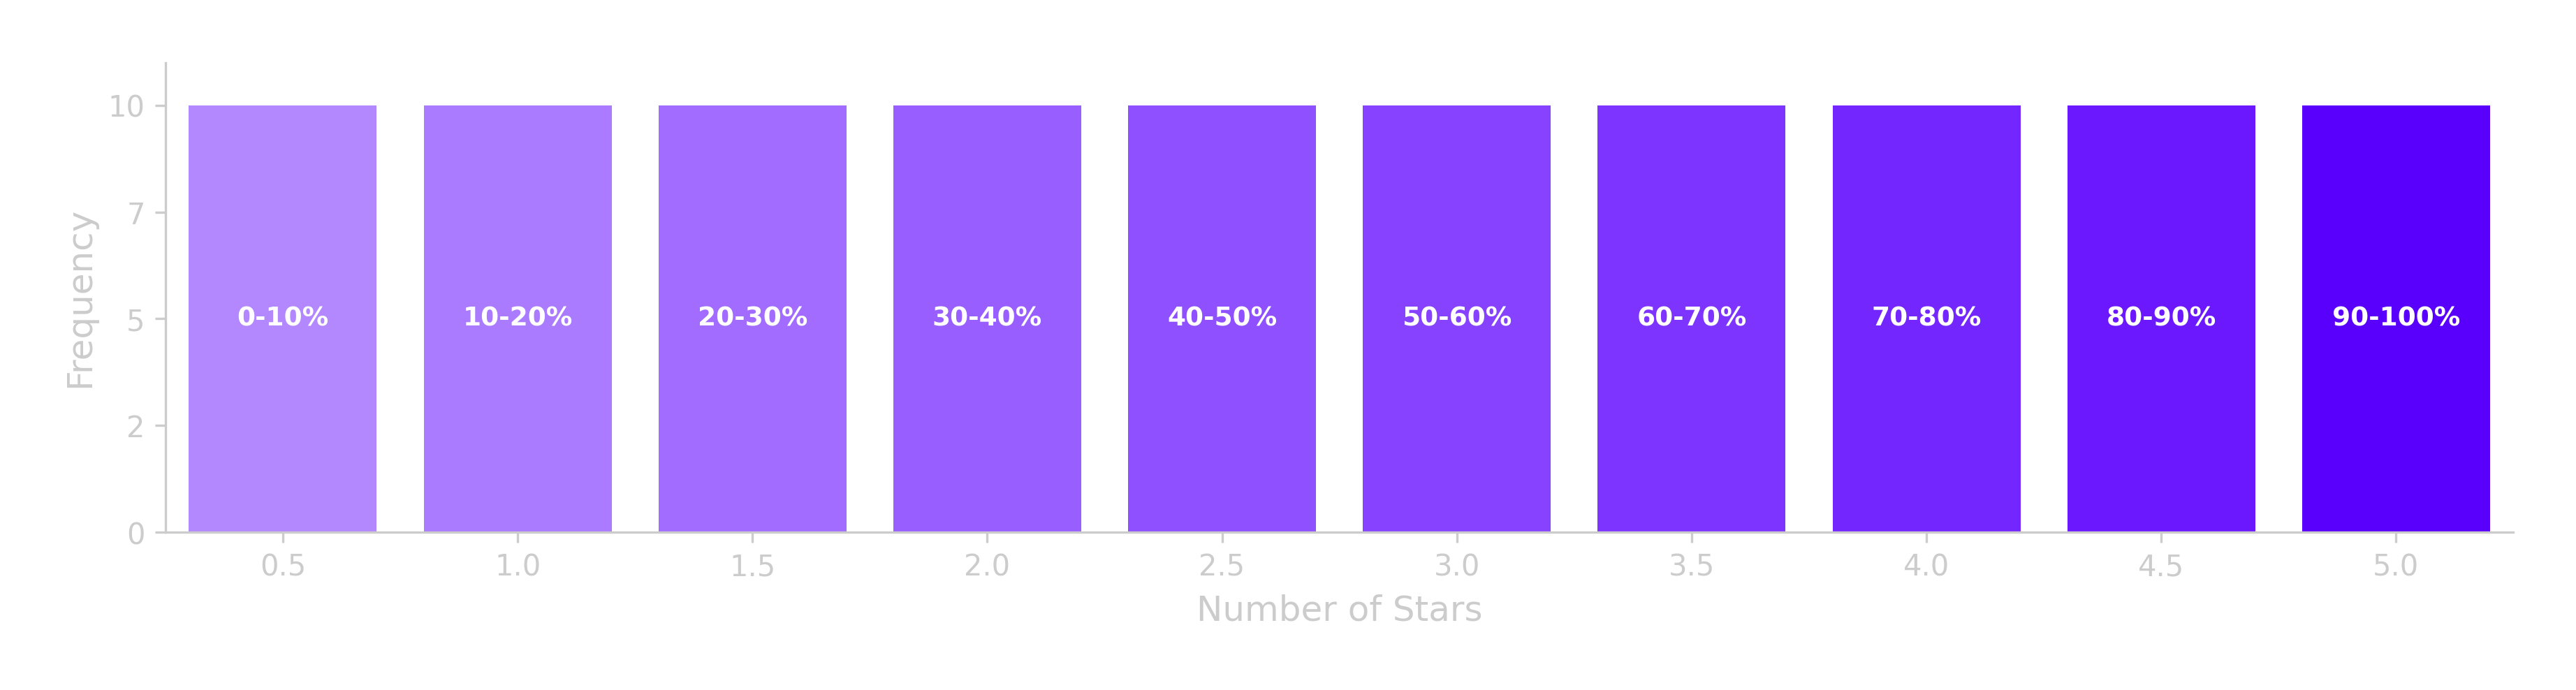
While this is optimal from an information theoretic perspective, it is not optimal for personal tracking purposes. A 41st-percentile movie and a 49th-percentile movie are both just… fine? Who cares whether Transformers was a 4.1 or a 4.9 out of 10?
At the top though, we care a lot about those extra 8 points.
A 91st percentile film is just great, whereas a 99th percentile film will be one of the top few films you’ll ever see. This difference is worth tracking.
So we only care about maximizing information where it matters, and this points towards compressing away the middle part of our distribution in order to gain granularity at the top end.
Redistribution
If we aggressively compress the middle and shift that granularity upward, we get something like this:
Our top end looks much better. Any movie that is 70th percentile or above will be classified pretty accurately!
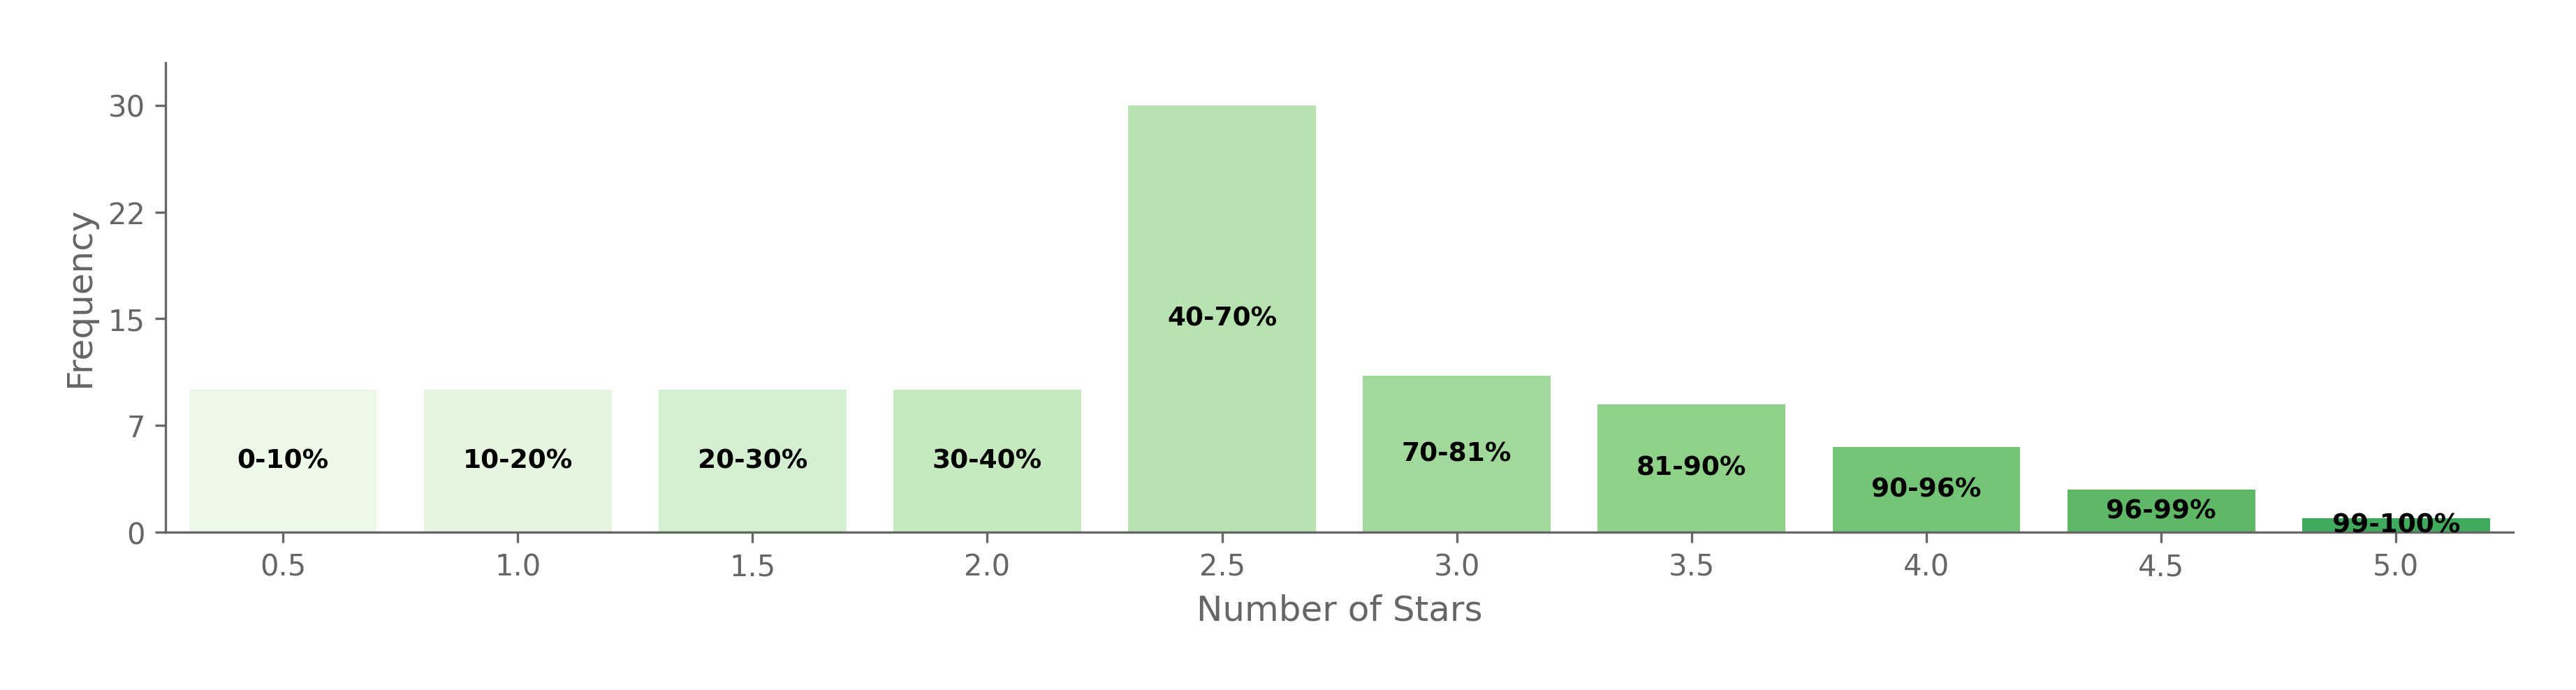
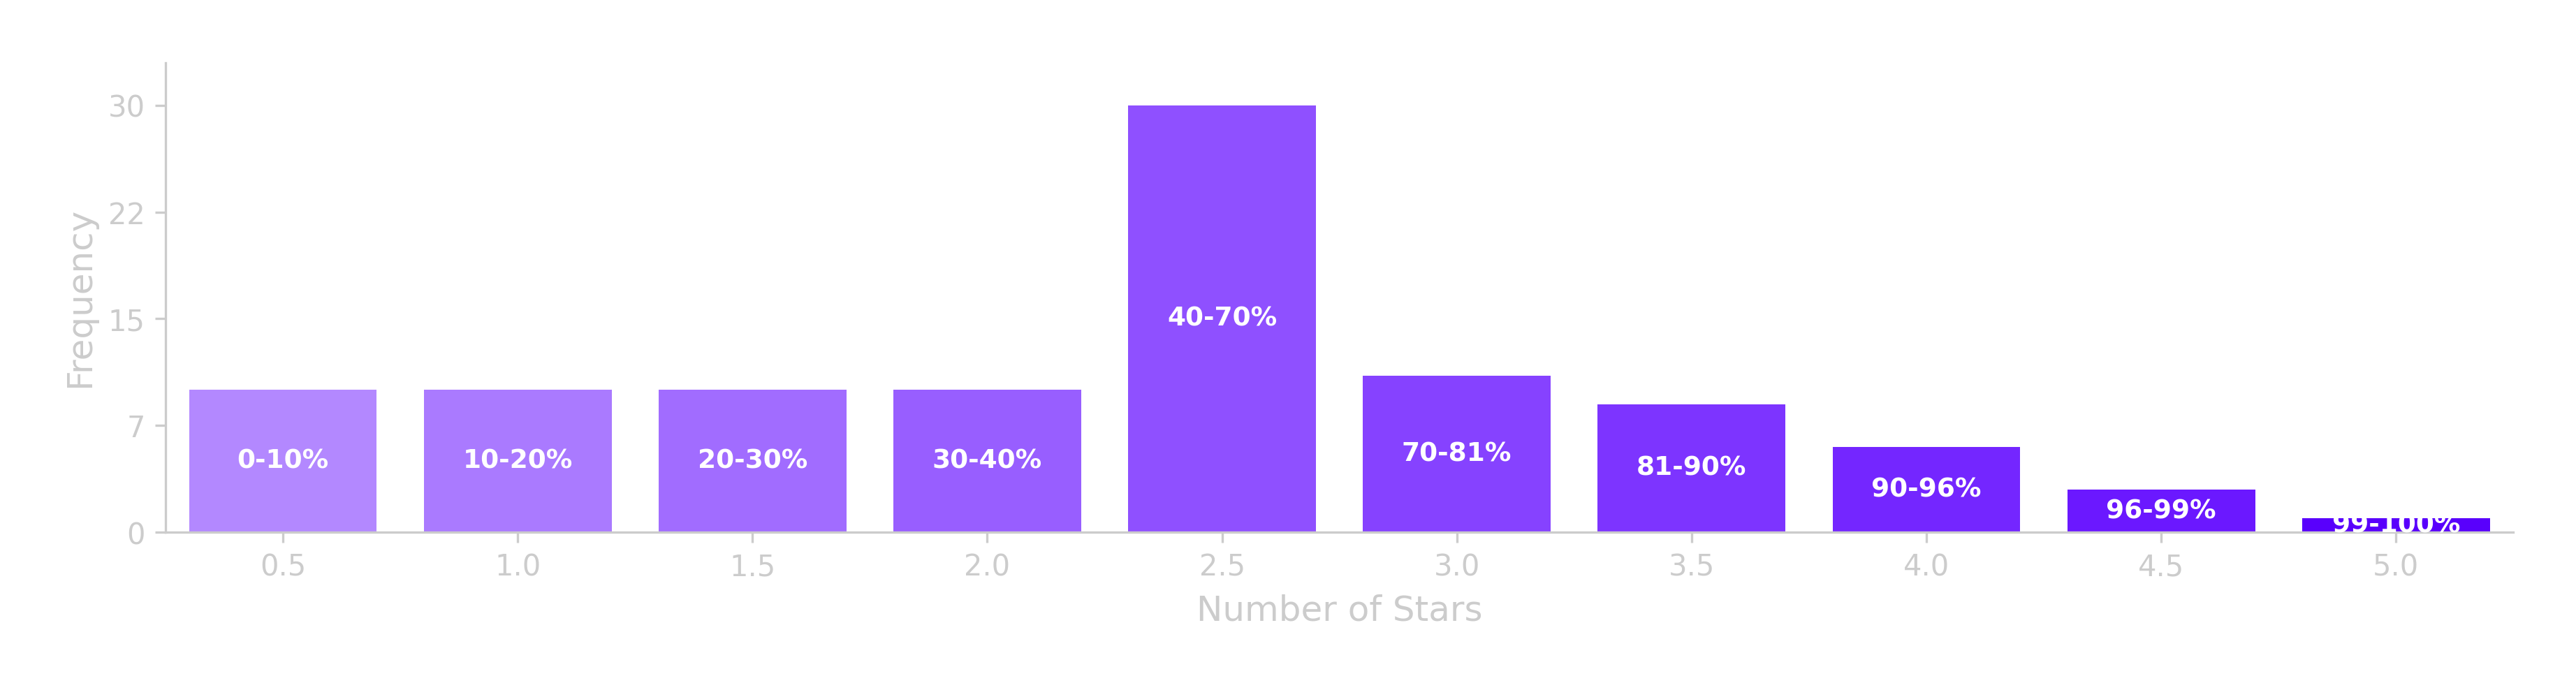
But, this still isn’t great. We want to be able to distinguish between a 40th and a 69th percentile movie. Let’s smooth out the distribution a little, and also give ourselves a little bottom end granularity so that we can distinguish the truly horrid movies:
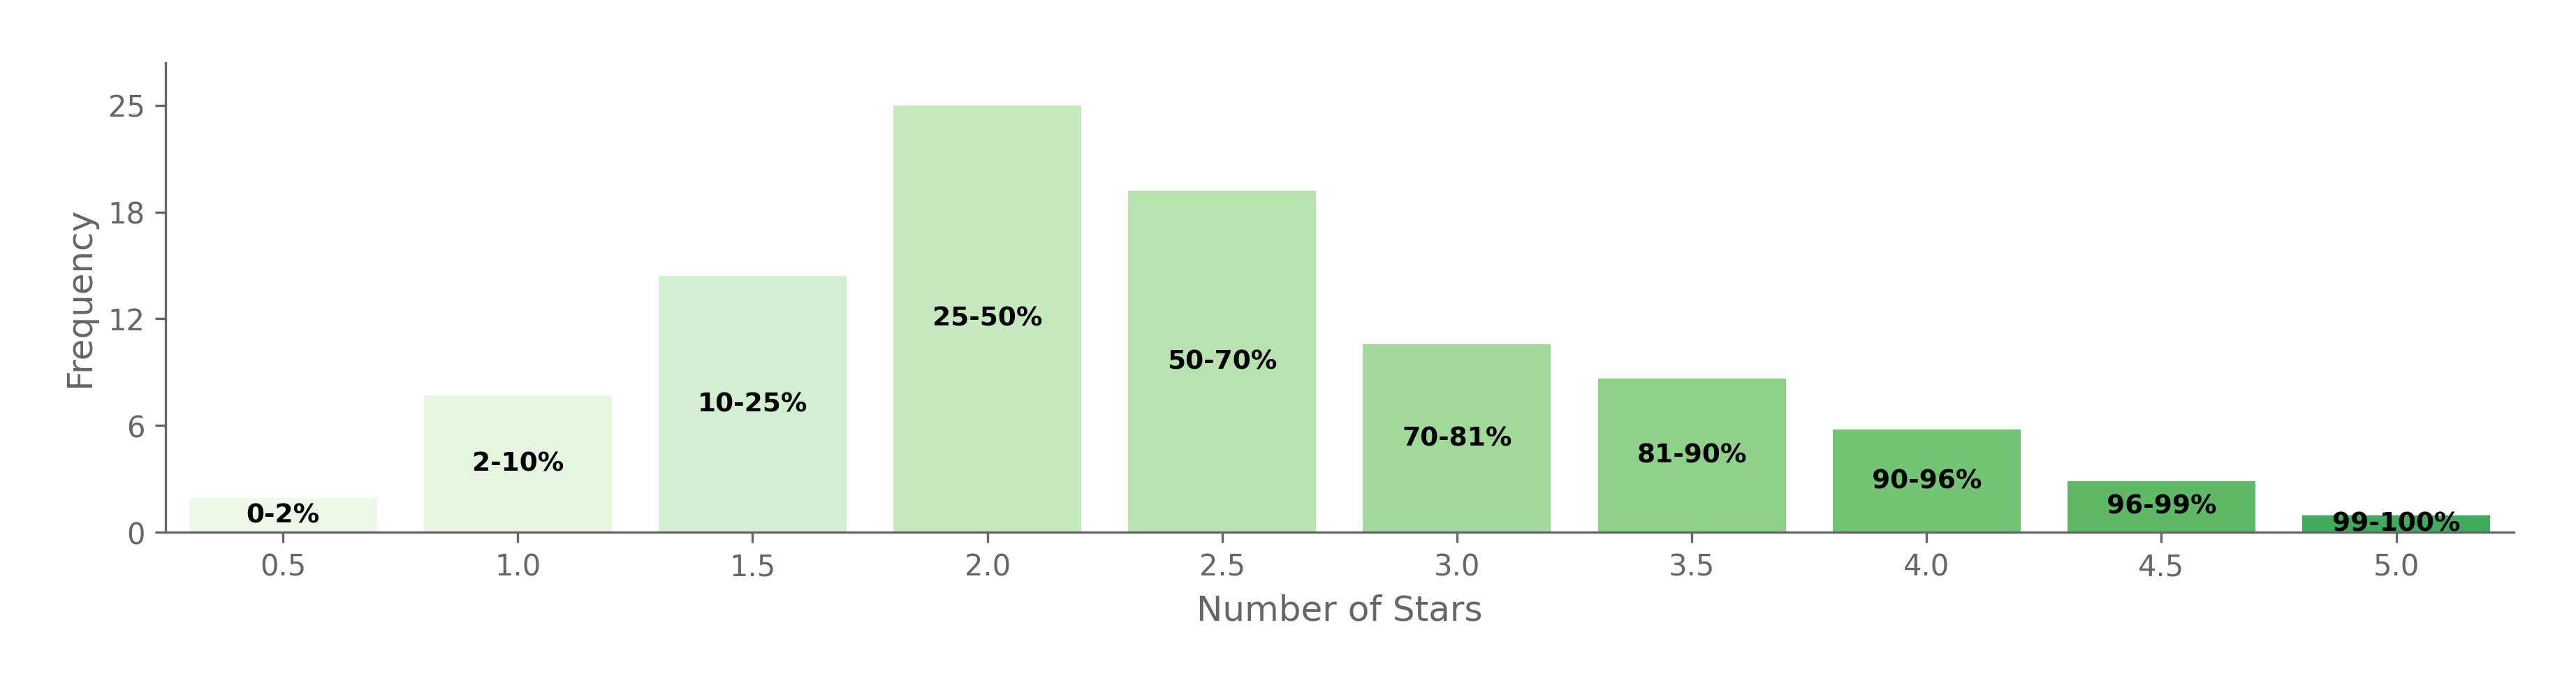
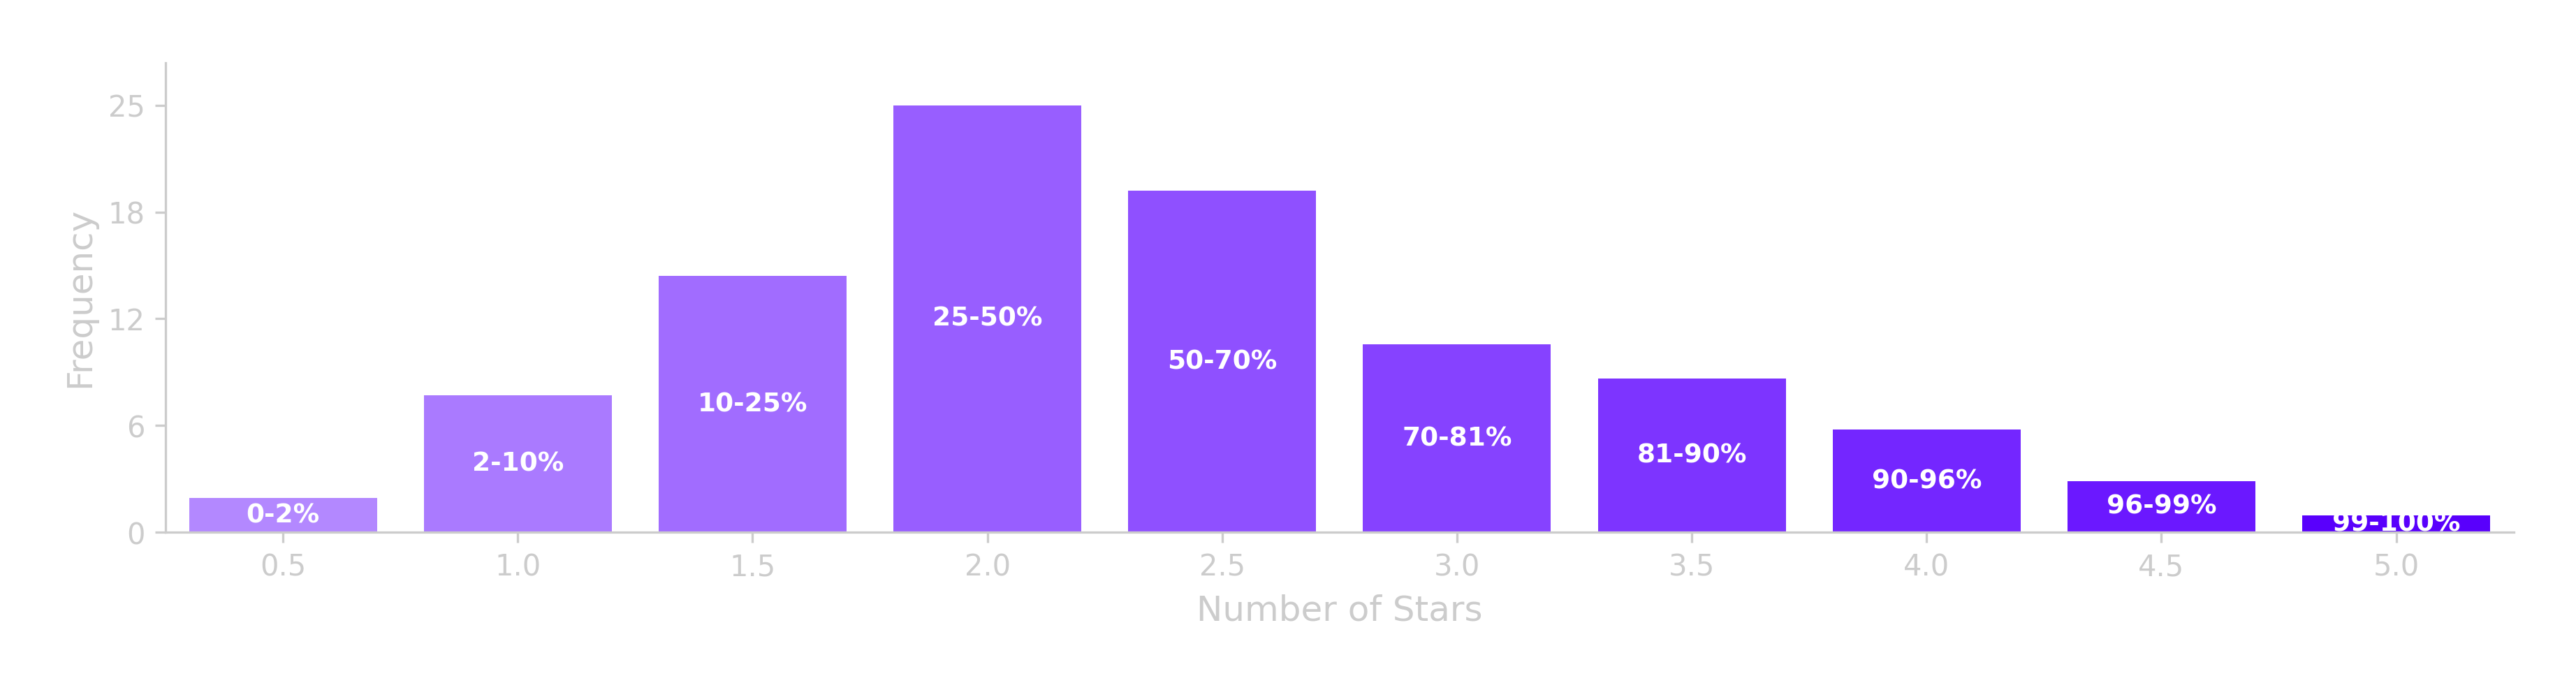
This looks pretty reasonable. Of course, individuals would be free to deviate on personal preference as well as on the thing they are rating. Someone who enjoys hate-watching movies might want more bottom-end granularity. A restaurateur might compress less aggressively, since a single visit only samples a slice of what a restaurant offers.
Implementation
“But wait,” you say, “this is all well and good in theory, but when I walk out of a restaurant, I don’t have a percentile ranking computed. I just have… vibes.”
This is valid, and it’s a problem with the current system too – we just don’t think about it. When you rate a restaurant, you are implicitly claiming that it is better than some percentage of restaurants that you have been to. You’re just doing the percentile calculation intuitively.
Here is how to actually implement this:
-
Calibrate. For your first ~50 ratings in a domain, don’t stress about getting each one right. Just rate things, then go back and shuffle stuff around until your distribution matches your target curve.
-
Extract anchors. Once you have a calibrated set of ratings, identify “anchor” items that you know well and can use as boundaries. For me, Halal Guys is my 2nd-percentile restaurant – the boundary between 0.5 and 1 star. The local Lebanese place I’ve been to dozens of times is my 70th-percentile restaurant – the boundary between 2.5 and 3 stars. And so on.
-
Rate by comparison. When you encounter a new restaurant, don’t try to compute a percentile. Just make a few comparisons to your reference points and you are done.
-
Recalibrate. Your reference points will drift. And if you get a new job and start eating at fancier places, your old anchors will become stale. When things feel off, recalibrate.
Look, this doesn’t fix everything. The point is just to make your own ratings precise enough that when you or your friend looks at your scale, the stars actually mean something. And if enough people adopt similar shapes – compressing away the middle – the aggregate becomes more telling too. But that’s a bonus, not the ask.
◆ ◆ ◆
Thanks to draft readers Michael and Varun.